
Aruba Central is a cloud-based platform for managing wireless or wired networks containing Aruba APs, Gateways and Switches. Core features allow users to manage and monitor devices across their networks, and added services are available from the web interface as apps. These apps include Clarity, which monitors deployments and provides visibility to proactively detect network performance issues, Guest Access, which allows control of guest user access and creation of a splash page, and Presence Analytics, which detects client device presence within range of the networked APs. Presence analytics in particular are seen as having increasing significance in many businesses as they provide visibility of customer footfall and engagement. This blog aims to introduce the presence analytics features of Aruba Central, and give a brief introduction to the accompanying API to allow integration of this data with your own applications.
While Aruba Central is a subscription package, there is a free trial version available: https://www.arubanetworks.com/products/networking/management/central/eval/.
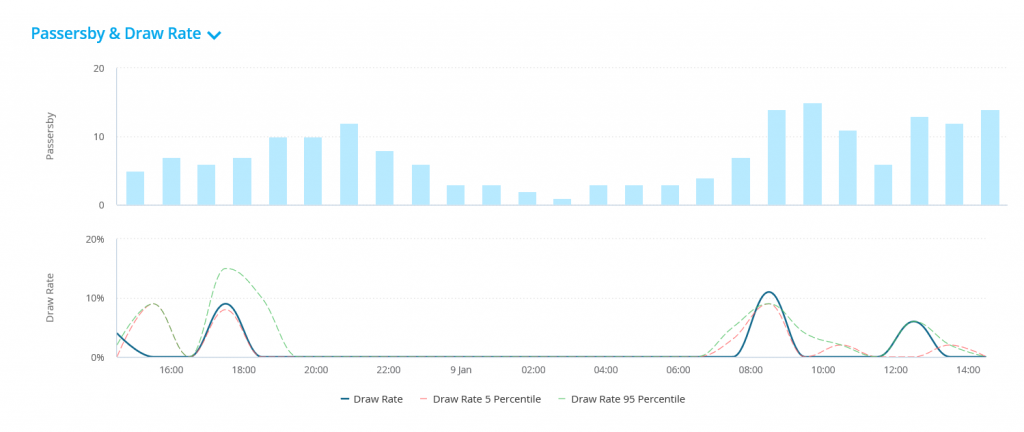
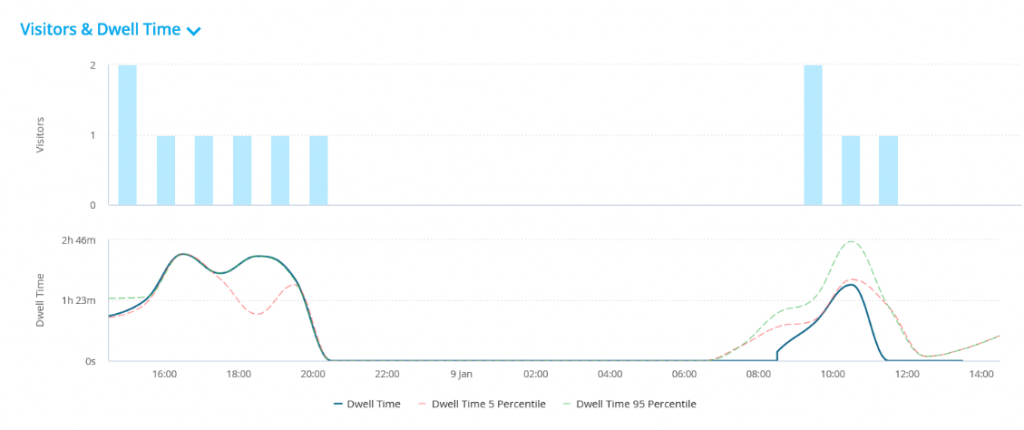
Enabling the Presence Analytics service app sets Central-controlled WLAN APs to detect the presence of Wi-Fi enabled clients within range of a particular site, with data gathered, aggregated and displayed by Central. Clients can be classified as ‘passersby’ or ‘visitors’, based on thresholds for Wi-Fi signal strength (RSSI) and time spent at sites (dwell time):
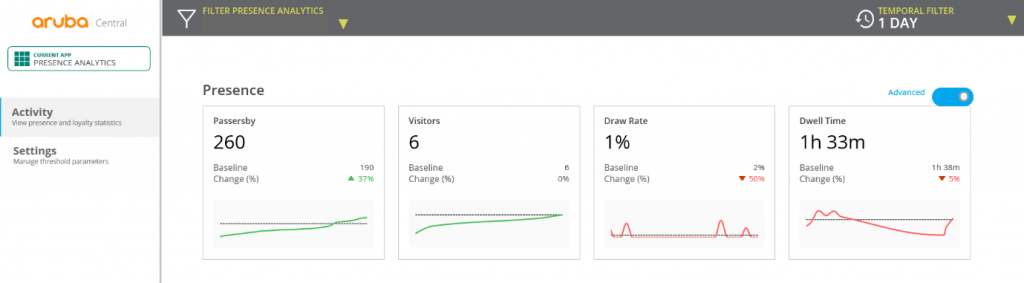
- Passersby – associated or unassociated client in the vicinity of a site exceeding RSSI threshold (-90 dBm).
- Visitors – passerby clients exceeding a higher RSSI threshold (-65 dBm) and dwell time (5 minutes).
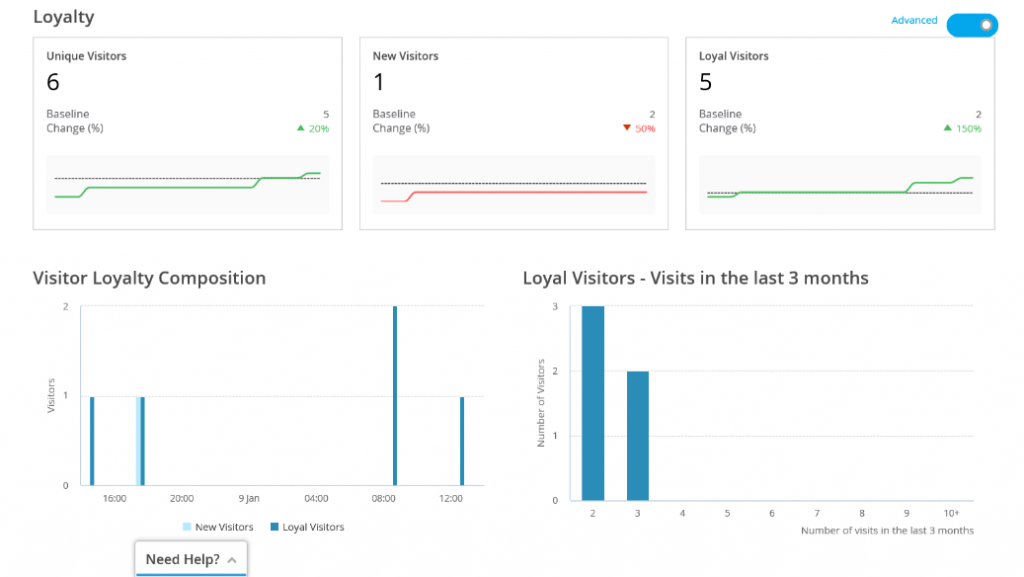
- Loyalty metrics – records are kept of the number of repeat visits made by clients over a specific duration, providing a histogram of visit frequency. Unique visitors are broken down into new visitors: those with one visit in the last month, and loyal visitors: those with more than one visit in the last month.
- Wi-Fi connected devices – Wi-Fi clients that connect to the Guest or Employee network.
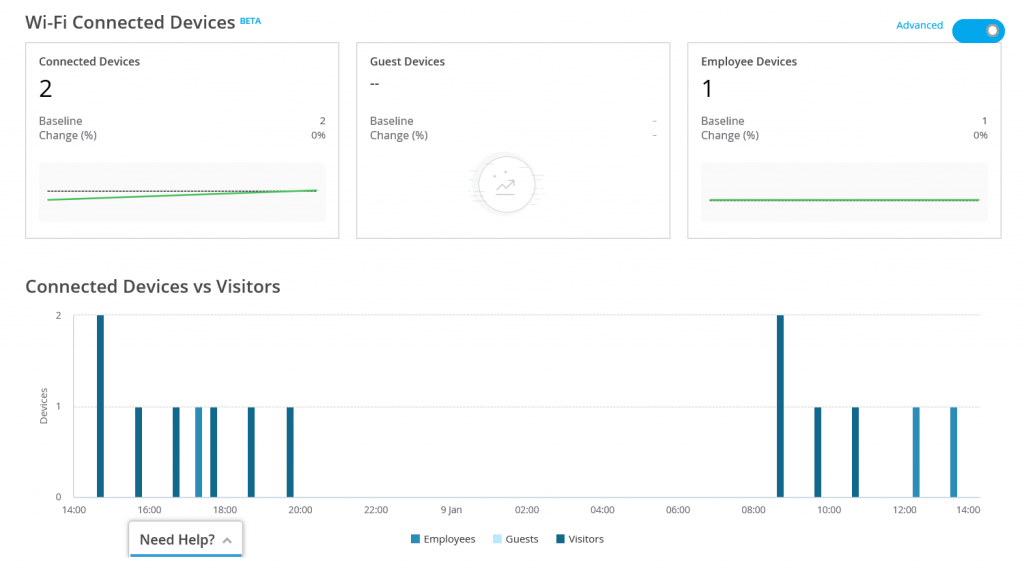
In each case the metrics are provided as aggregate values over an appropriate time interval based on the time range selected for the displays in the “Temporal Filter” dropdown. Context is provided in the form of the baseline values for the preceding time range and the percentage change in the metric value with respect to the baseline. More detail on the various metrics described here is available from the Aruba Central documentation: http://help.central.arubanetworks.com/latest/documentation/online_help/content/public_cloud/applications/presence_analytics/pa.htm
Many enterprise customers may wish to take this analytics data for their own purposes, such as long-term retention and reporting within their own custom applications or a third-party application such as Splunk. This is achievable via the use of the Aruba Central API Gateway, which provides REST API access to all Aruba Central services.
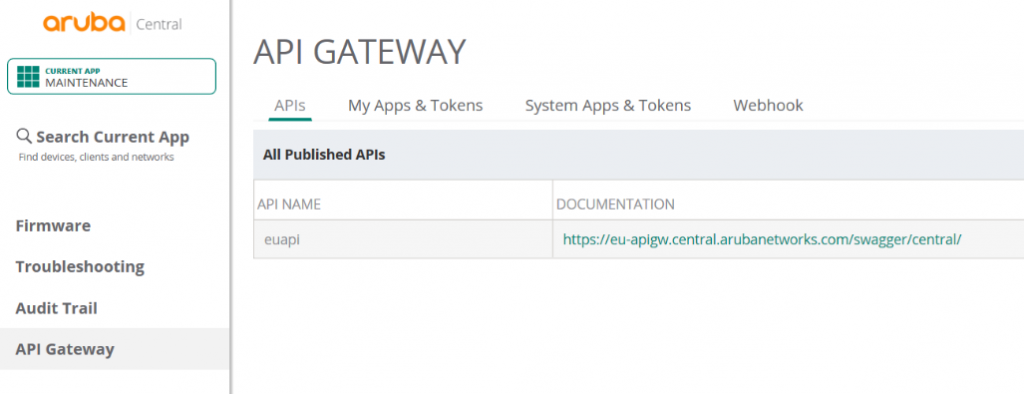
To allow authentication and authorization for your application, start by creating a new token in Aruba Central: select the Maintenance App then ‘API Gateway’ > ‘My Apps & Tokens’ > ‘Add Apps & Tokens’, name your application if allowed (non-admin users on Aruba Central will have the name fixed to their username) and select Generate. The new token will be listed in the Token List; select ‘Download token’ and your browser should display a popup containing multiple key-value pairs. The important value here is the “access_token”, which we will need to supply in API calls. The access token has a lifetime of two hours, however it can be periodically replaced in any application using the “refresh_token” with an API call. This is the OAuth 2 method of authorization. To use the API to retrieve the presence analytics data, note the appropriate base URL which can be found under the ‘APIs’ tab; in our case, this is https://eu-apigw.central.arubanetworks.com.
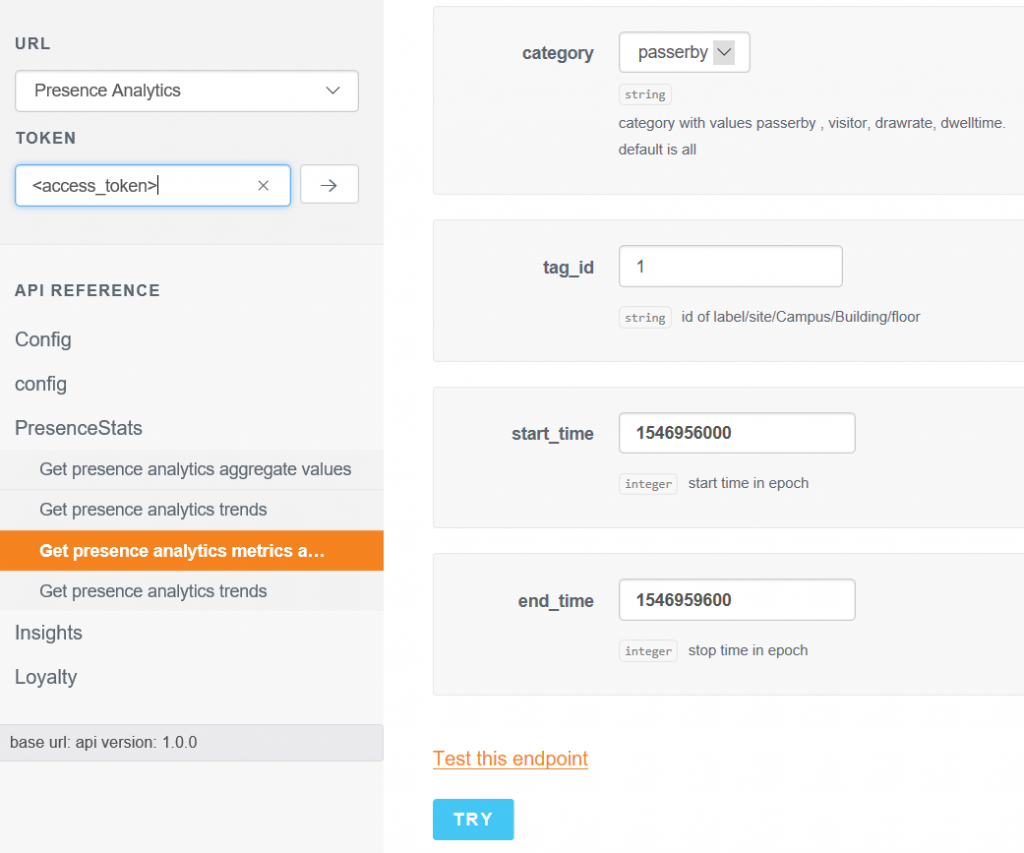
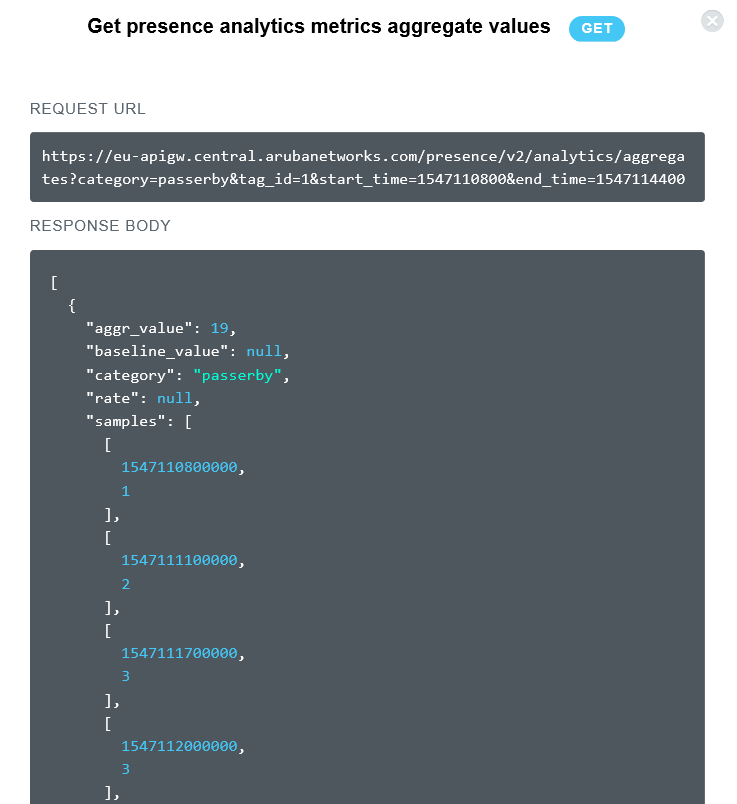
The many features supported by the API are demonstrated within the interactive documentation available from the link in the API Gateway. The first display below shows the format of the documentation; the dropdown on the left under ‘URL’ allows a particular topic to be selected and the available endpoints are listed beneath under ‘API Reference’. We also need to provide the access token; this can be copied and pasted into the ‘Token’ box and applied by clicking the adjacent right-arrow button. The parameters for the API endpoint need to be specified, in this case the category and start/end times for the metrics, and the numerical ID for the site/building etc. you want to obtain the metrics for. Now select ‘Try’ to send the API request (GET in this example); assuming no authentication errors and valid parameters are supplied, the response will be JSON or a list of JSON objects as shown in the second display below. In our example the samples provide the values of the ‘passerby’ quantity at regular time increments between the start time and end time, labelled by epoch time in milliseconds.
To sustain the authentication and authorization of the application beyond two hours, the access token must be refreshed using the refresh token. To do this we need the Client ID and Client Secret for our app or user account, found under ‘My Apps & Tokens’ in the API Gateway. We send a POST to https://eu-apigw.central.arubanetworks.com/oauth2/tokenwith parameters client_id, client_secret, grant_typewhich is specified as ‘refresh_token’, and the refresh_tokenthat we received with the original access token. If successful, the API call will return a JSON object containing a new access token, valid for another 2 hours, and a new refresh token to replace the access token when required.
In any applications API calls will typically be made programmatically. The above API calls and parsing of the responses can be done by libraries available in many programming languages. In cases where the manual creation of the initial access token via the Aruba Central portal is not practical, this can also be done via an initial series of API calls. These are documented in full in Aruba’s API Gateway automation guide: http://help.central.arubanetworks.com/latest/documentation/online_help/content/pdfs/central/aruba_central_api_gateway_automation_guide.pdf.
Use of the API is simplified even further by third-party data collection tools such as that available in Splunk. The REST API data input available in Splunk can be easily configured for OAuth 2 authentication, and a custom Python response handler can be assigned to alter the format of the response before indexing.
Hopefully this gives you an idea of the kind of presence analytics you could be getting from your Aruba APs, and how to get started in retrieving these metrics to use in your own applications!